A Prediction of Marine Plastic Debris Growth

Although it is common knowledge that plastic waste finds its way to the ocean en masse as evidenced  regions of high marine debris such as the great Pacific Plastic Gyres, there are few statistics that put exactly how much plastic enters the oceans into frame. A study published in February of this year looked to do exactly that, estimating that in 2010 an approximate 4.8-12.7 million metric tons of plastic entered waterways over 192 coastal countries that year.

This estimate was generated by taking into account local statistics for waste generation per capita and population growth trends to predict the amount of trash that shoreline countries produced within a 50 km region from the coast. An approximation of 11% plastics content for the produced waste was then applied, and transformations were imposed to convert total plastic waste to mismanaged plastic waste and finally to marine plastic debris. The authors of the study state that their estimate is one to three magnitudes higher than estimates made based upon gyre plastic content and justify this by reasoning these other estimates to only account for buoyant plastics. However, this large discrepancy between the predicted value and others brings the accuracy of the estimation into question. In the materials and methods section, the described transformation from mismanaged waste to marine waste was arbitrarily set at a percentage set of 15%, 25% and 40%, values that were deemed conservative based on a described estimation for the San Francisco Bay area.

Fig. 1: Projected plastic marine debris entering the ocean from 2010 on (Article in Discussion)

The study also estimated based on the same model that a cumulative 100-250 million metric tons of plastic waste would enter the ocean by the year 2025. This range was based on an extrapolation of population growth and plastic waste content growth rates in the past, and for this reason may be brought under scrutiny considering emerging efforts to stifle plastic waste pollution. However, the numbers produced in this study still has shock value, which lends them importance. Knowing that these enormous numbers are estimated based on current and past trends should in itself be a wake-up call since the implication is that our current lifestyle is unsustainable and resonates into the foreseeable future. In other words, this study is a call to action for all countries to set measures in place that will curb marine pollution currently and protect our future oceans.

The study goes into further detail about the extent to which efforts to reduce plastic waste in the near future will affect the amount of plastic trash that ends up in the world oceans and also gives a more detailed breakdown of the contributions of each country to marine plastic debris. It is definitely worth checking out and can be found in full text here. Thanks!

Insights into Early Hominin Communication

A recent article published in Science looked to the skull shapes of early hominins, a group comprised of our now-extinct closest ancestors and ourselves, as a prediction of what sort of auditory sensitivity they were capable of, with interesting results. The shape and size of the auditory apparatus in animals affects the intensity with which each frequency register is perceived. In the study, the inner ears of early hominins, chimpanzees and modern humans were scrutinized, and the modeled ear parts of each were used to make predictions regarding the frequencies that were more easily heard, and the results were plotted as shown below. 

Fig. 1: Sensitivity to sound over a range of frequencies (article in discussion)

In the figure, the y-axis corresponds to the log of the ratio of sound power to reach the cochlea, Pcochlea, versus that of the sound source, Po, as a measure of the perceived sound intensity. The researchers conducting the study were able to show that the early hominins had a higher sensitivity to sound at around 3kHz than both chimpanzees and modern humans and generally higher sensitivity to lower frequency sounds as well, showing a decrease in sensitivity at higher frequencies that is more similar in trend to the hearing curve of chimpanzees than it is to humans. Modern humans, in contrast to the others, have a similar sensitivity curve at lower frequencies but extend hearing to higher frequency sound, dropping off near 4kHz frequency. In analyzing this finding, the researchers came to the conclusion that the adaption to a wider frequency range of hearing in modern humans was imperative for the development of consonants in human language. The researchers considered that the phonemes t, k, f and s in particular are associated with higher frequency sound and that the ability to perceive sound over a wide range of frequencies makes these sounds more distinct from each other. Since early hominins were incapable of perceiving the upper frequency range that modern humans can, the researchers postulate that communication between the early hominins would have been vowel-intensive. They make a point, however, of stating that this finding does not confirm any information about the extent to which early hominin language was used or developed; early hominins may have used a “low-fidelity social transmission” form of communication similar to that of modern chimpanzees. Nevertheless, the skulls of these early hominins have given us another insight into what life was like for some of our earliest ancestors.

The complete article on the differences in sound perception described above is available here. While the article is heavy on jargon, the results and discussion sections can be understood without fully understanding the early talk of ear anatomical differences. 

Also, please let me know your thoughts on this trial article in the comments. I am trying something new with the posts here, providing brief summaries of emerging science rather than explanatory articles of everyday phenomena. Feedback helps me decide what content I post. Thanks!

Boiling Water at High Altitudes: A Representation of American Scientific Literacy

A recent survey by the Pew Research Center found that Americans are more likely to answer correctly questions related to basic science concepts than to scientific understanding [1]. Among the bank of questions, ones such as which layer of the earth is hottest and whether uranium is used in nuclear energy were answered correctly more often than ones such as whether the amplitude of sound waves causes its loudness. The question answered incorrectly most often was whether water at higher altitudes boils at lower temperatures with only 34% of respondents knowing that, indeed, it does.

Fig. 1: Results of Pew Research Center survey (Pew Research Center, same as reference 1)

Public scientific literacy is an important goal to work towards for developed countries. As Cary Funk and Sara Kehaulani Goo of the Pew Research Center posit, the ability to understand scientific concepts is crucial to people being well enough informed about current issues such as GMOs and the energy crisis to make educated decisions in the polls. Scientific literacy also makes daily life easier by finding more efficient solutions to everyday problems.

As a small step towards improving scientific understanding, let us discuss why it is easier to boil water at higher altitudes.

Liquid water and water vapor exist in a sort of equilibrium. There are a number of factors that can shift this equilibrium, but one we interact with daily is temperature. Say you spill a glass of water. Of course, a large spill would require immediate attention, but if only a thimbleful of water was spilt, some would be inclined to let it evaporate. Evaporation involves two main processes at play. First, the water is receiving kinetic energy from its surroundings in the form of heat energy. Second, the water is in higher concentration in the spill than in the spill’s surroundings and therefore a concentration gradient is formed at the water’s surface.

So what has this all got to do with boiling water? Well, water boils when transforming into a gas. Therefore, boiling water is a phase transition described by the equilibrium between liquid water and water vapor. Besides temperature, pressure also affect liquid-gas equilibrium as described by the ideal gas equation,

                  1.       PV=nRT (P is pressure, V is volume, n is number of molecules in moles, R is the gas
                   constant, T is temperature)

LeChatelier’s principle states that a system in equilibrium will move away from an induced change. In the case of an increase in pressure, we can see that if n and T remain the same then the ideal gas law describes a shift to decrease V, volume. On the other hand, a decrease in pressure should cause a shift towards a higher V. This means that at lower pressures, water prefers to exist in a gaseous state and the equilibrium shift will cause the water to boil. This is the foundational concept of rotary evaporators, which use the concept of reduced-pressure boiling to remove solvents.

Fig. 2: Deriving atmospheric pressure in atm's (Pearson)

Now all that is left is to link pressure to altitude, which isn’t too hard. By definition, atmospheric pressure is defined as the weight of the atmosphere over an area at sea level [2]. For example, one inch of land at sea level partitions a pillar of atmosphere weighing 14.7 lbs, so atmospheric pressure in PSI is 14.7 lbs/in2. A logical extension of this concept would tell us that at any altitude greater than sea level, the pillar of air would be shorter and would consequently weigh less. This is the missing link we were searching for between pressure and altitude. Putting all of the above information together, we see that a decrease in pressure causes liquid water to favor boiling and that an increase in altitude causes atmospheric pressure to decrease. Therefore, water boils easier at higher altitudes.

Scaling the results of the survey to education levels, the Pew Research Center also found a correlation between higher education and scientific knowledge. But this is not a given. Even as college students, we must all work towards insuring that we are among the scientifically literate ready to contribute educated opinions to today's social debates.

Approaching Herbalism from a Scientifically Literate Perspective

Is there really a founding for believing in herbal medicine? This seems to be a question many Americans are asking in a time when the concept of “human is better” is waning in favor of a return to an attitude that acknowledges we have a lot to learn from nature. Much of herbal medicine may seem like hocus-pocus, but scientists are not as against herbalism as some would think.

A first thought when someone mentions herbal medicine might be something along the lines of dried seahorse and mummified gecko. This is especially true for Americans where there is a high Chinese cultural medicine presence and where such practices are often caricaturized by the media. However, not all herbal medicine is so strange. Some common examples of herbal medicine practice could be honey-ginger tea for a sore throat and aloe (Aloe vera) for sunburns, both of which can be commonly bought in major store chains. As it turns out, much of the world uses some form of herbalism [1]. This shouldn’t come as a surprise. It is against human nature to accept illness as it comes, so wherever there are people there is likely to be medicine as well. But living in the time we do, both traditional herbal medicines and contemporary scientifically produced medicines are readily available. So which should we choose?

Fig. 1: Herbal medicine utilization by country (ClubNatu, same as source 1)

Herbal medicine is steeped in traditional medicine practices that developed before the scientific method and its instruments were available. Yet even so, many herbal remedies have come about through a rather logical process. Take even a fictitious, highly religious pre-scientific society where medicines are attributed to gods. If a medicine doesn’t heal its patient, then the instinct is to throw it out primarily because it’s useless and perhaps also because it makes the gods look bad. Our ancestors were smart enough to develop a working knowledge of herbs through thousands of years of trial and error, a highly valued logical test still used today in medicine development.

The argument some give in favor of a return to herbal medicine is that it’s more “natural” than modern synthetic drugs. This is not a well-based argument from a scientific perspective. Instead, we should consider factors such as effectiveness, side-effects, general safety of the herbs and the ecological impacts of its widespread prescription, each of which must be individually assessed per herb. The effectiveness of herbal remedies is a subject of increasing research attention as many have proven to possess clinical efficacy. Aspirin, for example, emerged from a more mild treatment of salicylic acid, a chemical found to exist in the bark of the white willow (Salix alba) tree used in traditional medicine. It has recently become a growing practice to scientifically test a wide number of natural products and traditional remedies as a high-throughput system for scouting out potential new treatments. Some herbal remedies have also been found to offer their effects with less side effects than modern medicine [2]. This could be due to a plethora of possible reasons including active dosage or the presence of other compounds to neutralize negative effects.

Fig. 2: Most popular natural products (including herbs) in the United States (NCCIH)

So where do herbal medicines fall short? All medicines have their associated risks, but a lack of herbal toxicity knowledge and of prescription guideline enforcement brings into question the safety of some herbal medicines [3]. The ecological effects of manufacturing herbal medicines must be considered as well. Paclitaxel, a drug with anti-tumor properties listed on the World Health Organization’s List of Essential Medicines, is a natural product from the bark of the Pacific Yew (Taxus brevifolia) tree [4]. However, wild-crafting this compound would devastate the tree population. Thus there is an inherent economic limitation on herbal paclitaxel, and so the synthetic generation of this natural compound is now the main route of production.

Herbal medicine is a topic that has been making a comeback under the realization that we have much more to discover about our medical pasts through a scientific approach. Personally, I am inclined to believe this is a step in the right direction since it is never bad to know more about plants that could potentially save our health. After all, it takes just one paclitaxel to make the search worth it. Social opinions on herbalism as a form of alternative medicine are shifting towards the positive, and as scientifically educated individuals we should keep ourselves updated on this movement.  

Is That a Point?

If I gave you a sheet of paper and asked you to draw me a nickel, you’d probably draw me a circle roughly an inch in diameter, maybe labeled with a "5₵". If I asked you to draw me a mite, the smart alecks out there would probably dot the piece of paper and give it back. If I asked for a realistic drawing of an atom, the same group would likely hand me back the blank page. This sort of answer is likely meant to be taken as a joke, but it also provides us with an insight into the limitations of human visual resolution.

Human eyes are anything but perfect, and some are less perfect than others. And as the silly drawings of the mite and the atom suggest, the smaller the object the harder it is for the human eye to resolve. By the international standard of measuring human visual resolution, good vision is defined as 20/20 (feet system) or 6/6 (meter system), meaning that someone with 20/20 vision can resolve what a person should be able to see (by designation) 20 ft away at the intended distance [1]. Someone with 20/40 vision sees at 20 ft what someone with 20/20 vision can see at 40 ft away, and someone with 20/10 vision sees at 20 ft what someone with 20/20 vision can see at 10 ft away. As objects get smaller, they seem to us as tending to a point. This occurrence is often referenced in physics where a source with radius r a distance d away from a sensor where d>>r (d is much greater than r) can be approximated as a point source.

But how exactly do we characterize this phenomenon, and at what distance does leaning forward while squinting intently seem… pointless? Let's take a look at the diagram below:

Fig. 1: A Spherical Object Viewed at Different Distances (Orig.)

 On the left side there is a spherical object of radius r1 being observed by the first eye at a distance d1 so that the object fills the observer’s field of view (denoted by the first set of dashed lines). The circle surrounding the object with radius r2 represents the same observer’s field of view at a distance d2 where d2>d1. The corresponding angles are drawn in and labeled as θ1 and θ2. From this diagram, we can obtain the equations

                                                                         1.       r1=d1tan θ1
                                                                         2.       r1=d2tan θ2
                                                                         3.       r2=d2tan θ1

Dividing equation 1 by equation 3, we receive the statement

                                                                        4.       r1/r2= d1/d2

This equation tells us that as d2 increases, the ratio of the original full-view object radius to the radius of the field of view at d2 decreases as d1/d2=k/d2 α 1/x (k is used to show that d1 is a constant). The graph of 1/x is shown below:

Fig. 2: Graph of the Function f(x)=1/x (WyzAnt)

Where the x axis represents an increasing distance d2 and the y axis represents the ratio r1/r2. This finding seems to agree with our experiences, doesn’t it? Namely, as we walk further away from an object it seems to decrease in size relative to our entire field of view, the size difference becoming less noticeable as distance increases further. If we were to walk far enough away, then the object would appear as if it were a point in our vision.

So we now know how to describe the way objects seem to decrease in size at far distances, but at what distance does any sort of difference in the object not matter? That is, when does the object become a point? Based on the human vision resolution assessment described earlier, we know that at 6m, or 20ft, the idealized human should be able to resolve a standardized interval of one arc minute, or 1/60° [2]. From rearranging equation 3, we receive the form

                                                                         5.       d2=r1/tan θ2

Making the substitution of the maximum resolution for a 20/20 person’s vision, 1/60°, for θ2, we produce the equation

                                                                          6.       d2=3,438r1

This equation says that an object with a radius r1 can be seen from a distance a factor of 3,438 times its radius before a person with good vision can no longer sense its character beyond that of a point. This is like trying to see the face of a nickel from 146 meters away. While seemingly too far a distance to be visible, if we check equation 6 by substituting in the resolution corresponding to an arc minute at 6m, which is 1.75mm [3] (this can be checked with equation 1), then the distance returned is indeed 6m. With this information in mind, the next time you look up into the night sky I challenge you to think about just how big a star is compared to the twinkling dots you see above. Suddenly, it won’t seem so crazy to say we all live on the head of a pin.

Thank you guys for reading this post, and be sure to look out for more to come. If you want to be updated whenever I make a new post, sign up for email notifications on the right side column of the blog so you can have new posts sent directly to your email. Alternatively, if you send me a message on Google+ I'll add you to be notified when I post new content. If you have any suggested topics for future posts or you liked this post, let me know in the comments because I’d love to hear your thoughts. Thanks!

Birthday Borax and An Explanation of Crystal Nucleation

For my birthday a while back, a friend of mine gave me food coloring, a box of borax and spools of thread. I asked what they were for, and she said crystals.

Fig. 1: Borax crystal growing birthday gift (orig.)
Of course! I hadn’t ever seen people grow borax crystals before, only sugar or salt, so I looked up a tutorial on YouTube. The procedure was pretty standard: heat water up to near boiling, dissolve the borax, insert a pipe cleaner or thread and wait overnight for the solution to cool down and precipitate out crystals. But while the procedure is simple, the science behind nucleation is more complicated and pretty interesting.

In order for a crystal to form in solution, molecules of a substance must conglomerate to an adequate size to encourage the spontaneous coordination of more molecules. A cluster of this adequate size is called a "nucleus," and the process of its formation is called "nucleation." Clusters that are not large enough to be nuclei are called "embryos." The nucleation process can be described in terms of Gibbs free energy, which accounts for both enthalpy, related to the nucleus’ internal energy, and entropy. Gibbs free energy is given by the equation

                      1.       ΔG=ΔH-TΔS (H is enthalpy, T is temperature in Kelvins and S is entropy)

For a newborn crystal born homogenously (meaning suspended in a medium without contact with other surfaces), there are two main energy changes that are occurring. The first is a lowering of molecular energy due to the formation of attractions between coordinating substance molecules for reasons described in Why Cold Drinks "Sweat". This change in energy can be describe by the equation

                  2.       ΔG=VΔGv (V is volume, ΔGv is the change in internal energy per unit volume)

To find ΔGv, we will assume that the crystal-solution system is cooled to slightly below the substance's melting point, Tm. At this small undercooling, ΔH and ΔS can be approximated as temperature independent [1]. But first, at Tm the difference in free energy ΔG between a substance’s solid and liquid forms is 0. Therefore,

                                                                      3.       ΔGm=ΔH-TmΔS=0
                                                                      4.       ΔSm= ΔH/Tm

Now, assuming that ΔH and ΔS are temperature independent, we can use the same expression for entropy as used at Tm to find the value of ΔGv. While we’re at it, let’s assume the crystal nucleus is spherical for simplicity’s sake. The following are therefore true:

          5.       ΔGv=ΔHfv-TΔS= ΔHfv-T(ΔHfv/Tm)= ΔHfv(Tm-T)/ Tm= ΔHfvΔT/Tm (from equations 1 and 4)
          6.       ΔG=VΔGv=4/3πr3(ΔHfvΔT/Tm) (from equations 2 and 5, Vsphere=4/3πr3)

The second energy change occurring is an increase in a newborn crystal’s energy because the surface of the crystal is disrupting bonding in the liquid medium around it. This change can be described as

          7.       ΔG=Aγs=4πr2γs (A is the nucleus’ surface area, γs is the surface free energy value
           characteristic of the medium-solid interface)

This expression is just the disruption free energy per unit area multiplied by the surface area of a sphere. Together, these two energy changes dictate nucleation. Putting the two expressions together, we get

          8.       ΔGhom=VΔGv+Aγs= 4/3πr3ΔHfvΔT/Tm+4πr2γs (ΔGhom indicates that this equation is for
           homogenous nucleation)

This equation is very useful and can be used to describe nucleation events from borax crystals precipitating to homogenous cloud formation. To tease a little more information out of equation 8, let’s see how ΔGhom changes in response to a substance clump slowly growing in radius. This rate of change corresponds to the derivative of ΔGhom with respect to radius r [2];

                                                             9.       d(ΔGhom)/dr=4πr2ΔGv+8πrγs

The point where ΔGhom no longer changes with r corresponds to the peak on the following graph of equation 8 and its component parts, equations 2 and 7.

Fig. 2: Free energy of nucleation as radius increases (Materials Science and Engineering, an Introduction)
Equation 2 is shown as a decreasing curve because ΔHf is negative for crystallization. This makes sense because as a material crystallizes, energy is lost to its surroundings, so ΔHf must flow out of the system. To find the critical nucleation radius,

                                           10.   d(ΔGhom)/dr=4πr2ΔGv+8πrγs=0 (from equation 9)
                                           11.   r*=2γs/ΔGv

Plugging the critical radius into equation 8 and extracting the negative from ΔHto avoid confusion, we get

                                  12.   ΔG*hom=-4/3π(2γs/ΔGv)3ΔGv+4π(2γs/ΔGv)2γs=16/3πγs3/ΔGv2

This expression describes the magnitude of the energy change needed to get a molecular cluster up to the size of the critical radius r*, a sort of activation energy [3].

However, homogenous nucleation is relatively difficult compared to heterogenous nucleation, as I’m sure you’ve probably heard. Heterogenous nucleation occurs when a nucleus forms on a surface, such as a dust particle for clouds or thread for nucleating borax crystals. Because of the complexity of finding heterogenous nucleation equations due to complex volume and surface area terms as well as extra surface energy considerations, I will not be posting these calculations. The calculations can be found in reference 3, but the summarized result is that the critical radius in heterogenous nucleation remains the same as with homogenous nucleation while the nucleation free energy lowers and makes the nucleation process more accessible. This is why minimizing dust or rough surfaces is important for growing larger crystals rather than clusters of small ones.

What has been described above is just a small bit of the complexity of crystal growing. Knowledge of nucleation rates and crystal growth is widely used in processes such as tuning metals to have properties fit for specific purposes or growing single-crystal silicon for computer processors, and I’m sure this information will come up again on later posts. But mild difficulty of math aside, it’s cool stuff, huh? As a treat for reading through this post, watch this fun Minute Earth video on the homogenous nucleation of clouds and see if you recognize some of the concepts we discussed.


I’m planning on growing some borax crystals soon, and when I do I’ll likely write an experiment post about it so be sure to come back and check that out. I’ve already had my first few days of classes and so far it seems that I will be able to continue posting once a week, likely on Sunday or Monday. As always, thanks for reading and I’ll be posting new stuff soon!

Primary Colors: Why One Set Wouldn't Suffice

Colors are a ubiquitous fact of human life. Imagine a world without colors; all of the great masterpieces would be painted in gray scale, that potato could be purple or brown and there would be no more blue skies. Experientially, we are highly familiar with the concept of colors, but I would say it isn’t common to understand the more technical side of the world of colors. Let’s explore this more analytical side and it’s applications as we try to answer a question most of us have probably had: why are there multiple sets of primary colors?

At the most basic, colors are categories of light within the visible spectrum that can be described as having either different wavelengths or frequencies since the two variables are directly correlated by the equation

                     1. c=λv (c is the speed of light, λ is wavelength and v is frequency)

The visible spectrum is comprised of the rainbow colors describe by the acronym ROYGBIV (red, orange, yellow, green, blue, indigo and violet). 

Fig. 1: Visible spectrum for humans (Arstechnica)
White is the presence of all wavelengths while black is the absence of light. Technically, there is no physical meaning associated with colors since the color spectrum is defined based on human capacity to perceive and differentiate different colors. That is to say, the visible spectrum and colors would be defined very differently had we been insects able to see UV light [1]. So keep in mind that all of this talk of analyzing colors is human-specific and don’t go off trying to explain it to your dog.

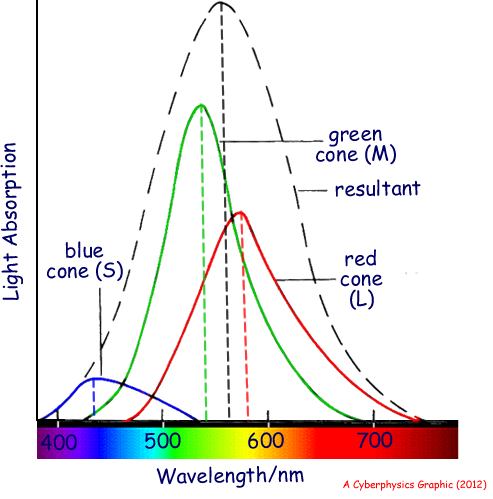
The human eye consists of rods, which perceive low intensity light, and cones, which perceive colors and high intensity light [2]. There are three types of cones, dubbed L, M and S, that respond to different wavelengths of light. The peak sensitivities for these three cone types are 580nm (red), 540nm (green) and 440nm (blue) respectively, adding to a maximum sensitivity at 560nm (in the yellow-green region of the spectrum) [3].

Fig. 1: L, M and S cone response curves and response sum (Cyberphysics)

This should start to sound familiar for those of you who are familiar with the concept of primary light colors or who have ever squinted really hard at a television screen. Aside from these three colors, other colors are perceived by simultaneous stimulation of multiple cone types. The color mixing ratios of red, blue and green light to perceive every color was actually indexed in 1931, creating the RGB CIE 1931 system [4]. The impact of breaking each color into three values of red, blue and green, called the RGB tristimulus values, is that each color can now be defined in three-dimensional space as a combination of three basis vectors representing red, blue and green relative intensity values. The mathematical derivation can be found in reference 4, but the result is the chromaticity diagram familiar to aficionados of tech wanting to know what range of human-perceivable colors their devices are capable of displaying. Look along the edge of the chromaticity diagram and you should find a color wheel for light.

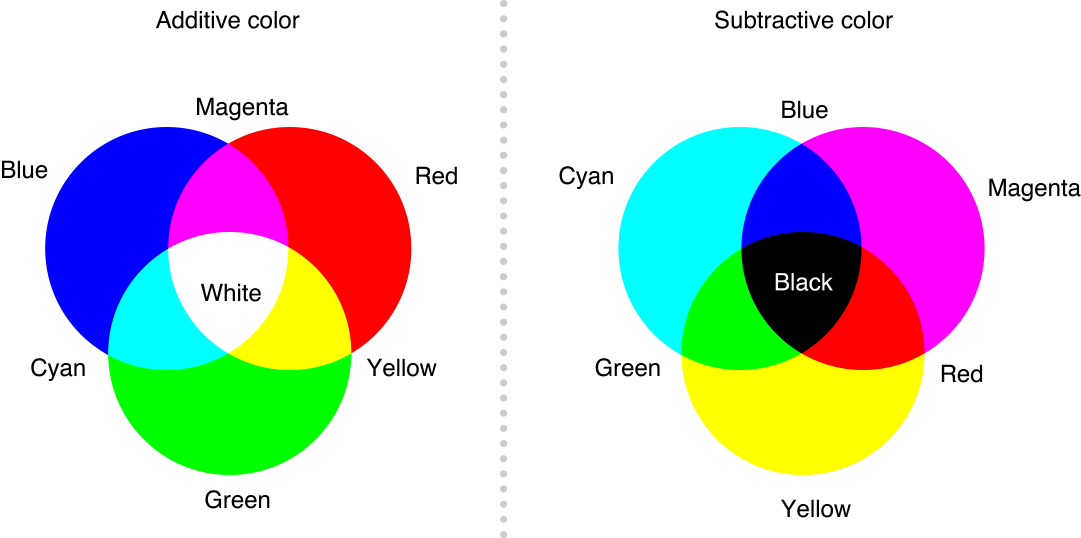
So far we have one set of primary colors consisting of red, blue and green that has widespread applications in electronic devices since many of these generate colors for humans to perceive when watching movies or reading billboards and such. But this set of primaries and its corresponding wheel only apply to the production of light by adding ranges of wavelengths together. This is called additive color. When light is absorbed by colored materials via quantum effects, as has been described in Thoughts in Black Ink, the color perceived is the light range that has not been absorbed. To describe the phenomenon of light absorption to generate a reflected color, the painter’s wheel was invented by Isaac Newton in 1666 [5] with the familiar primaries of red, blue and yellow. What this wheel describes is how subtracting light with certain ranges of wavelengths stacks to reflect light of a certain color when starting with ambient pan-frequency white light. However, this is not strictly subtractive color because the painter’s wheel adds to brown, not black as anyone who has tried to make black paint from the primaries in art class knows. The subtractive color wheel is defined with yellow, magenta and cyan as primaries and should be familiar as the different ink cartridges you probably put in your printer so that your computer can print black in theory (but black ink is cheaper).

Fig. 2: Additive and subtractive color (Mac Developer Library)

Why these three colors? It turns out that if you take the three primary colors of light, red, blue and green, and combine them two at a time, you get cyan, magenta and yellow [6]. And since the color of a surface is what the surface doesn’t absorb, each subtractive primary color cancels out one of the additive primary colors until no light is left. And there you have it, the three most common primary color sets.

This post was made in response to a comment by my friend Lilia back on the article How Soap Helps Us Clean. I haven’t address the comment until now because I knew there would be a biological component to this explanation and cellular biology is not my strong suit, hence the brevity with which I describe the rods and cones of the eye. But if you guys have anything you would like to hear about, feel free to leave suggestions in the comments below and I will do my best to write a post for you. Thanks!

Why Cold Drinks "Sweat"

With a horrible heat wave hitting the Philadelphia area, it’s good to think cool thoughts. Already feeling the heat last night, I left a coconut water in the freezer with the intent to drink it but forgot and so took it to work this morning frozen solid. I figured since it’s so hot outside and the metal can is a good conductor, it’d probably melt pretty quickly. And while the ice in immediate contact did melt, the inside remained frozen and I had to cut the top open with scissors to eat it. Before I figured this out, the can had already shed a puddle at my desk. Have you ever wondered why it is that cold things "sweat."

Fig. 1: My favorite coconut juice brand, Foco (pinstopin.com)

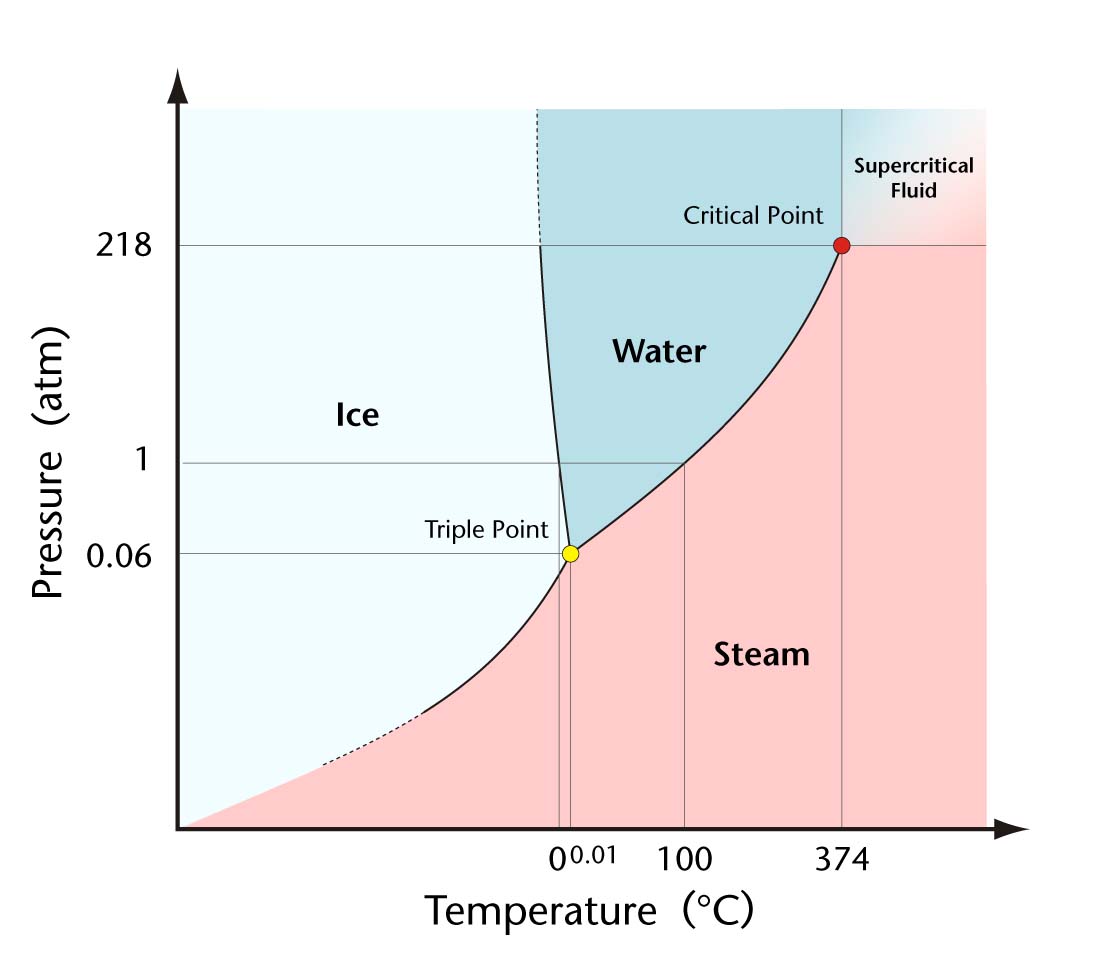
Most of us are familiar with the concept of condensation, having learned about the water cycle in elementary school. We are commonly taught in elementary that water exists as vapor at hot temperatures, condenses to liquid as the temperature drops and eventually expands (not condenses, as ice has a lower density than water due to hydrogen bonding) into ice as the temperature drops further. In high school, we learn about the ideal gas law and how pressure also affects phase transitions, yielding the phase diagram.

Fig. 2: Phase diagram for water (myhomeimprovement.org)
So from this standpoint, we are all familiar with why cold things "sweat." What else is there to it? While the basic principles stand, there are some other viewpoints from which we can view this phenomenon.

Phase transitions can be viewed as being an equilibrium process, as is demonstrated by the fact that an ice and water mix maintains a 0°C temperature. In such a mix, the ice melting and the water freezing are competing processes that are controlled by environmental factors; if you cool the mix the ice expands, but if heated the ice melts. Additionally, the entire mix must either become ice or water only before the temperature can deviate significantly from the equilibrium temperature of 0°C. What’s cool about this process is that if you track the energy entering the ice and water mix, say a glass of iced coconut water (let's treat this as an ideal glass of pure iced water), we can predict the corresponding phase transitions based on molecular kinetics.

When bonds are formed, whether strong or weak, we know that energy is released as heat. The reverse is true as well, breaking bonds requiring energy. The direction of bond energy transfer can be simplistically remembered taking into account the conservation of energy in a two molecule one-dimensional collision. Say two water molecules are moving towards each other and stick together upon impact. Where did the kinetic energy go? Ignoring molecular vibrations, the energy had to have been released as work, or heat. In order to separate the water molecules, we need to get them to move apart, a.k.a. add work, or heat, to yield kinetic energy. In our glass of iced water, this sort of energy transfer is happening extremely fast and on a large scale, one that can be described by Le Chatelier’s principle since the ice and water form an equilibrium.

Fig. 3: Ice-water equilibrium state (JVC's Science Fun)
Now let’s put the iced water outside on a hot summer Philadelphia day. From experience, we know that the ice will melt and the water will become unappealingly warm. If we track the direction of energy transfer, the higher energy hot air must be donating energy to the lower energy iced water simply because this is the default direction of energy transfer in our universe according to the Second Law of Thermodynamics. The added energy must translate into kinetic energy as temperature is positively correlated to molecular kinetic energy. From our two water molecule system we know that a decrease in water molecule association is predicted, favoring water over ice and vapor over water. This manifests as the ice melting and the water warming and eventually evaporating.  

What has been so far described, however, is only focused on the iced water itself. Let’s change our basis to focus on the hot air along the iced water glass instead (assume the water glass does not hamper kinetic energy exchange between air and iced water). Hot air carries a lot of water since at higher temperatures water enters the vapor phase preferentially according to Le Chatelier’s principle. From the viewpoint of the air, the cold iced water is pulling kinetic energy from it, accordingly cooling the air within a certain range of the glass. Plugging this information back into our two molecule system, the energy must be afforded by reducing the molecular kinetic energy of the air, increasing the probability of water existing in associated groups, i.e. water. And this is why a cold drink sweats in the summer.

Since school is starting up again, I will not be able to post as frequently as I have been during the summer. I will try to post at least once a week, and will probably be doing so during the weekend since this is when time is most available. Please have patience with me on this, and as always thanks for reading!

The Fun of Latin and Ballroom Dancing Explained with Mechanics

Last semester, I picked up Latin and ballroom dancing as a hobby. All through high school I didn’t dance, but thanks to the recommendation of a friend I decided to go to free introductory dance lessons. At first it was just fun to socialize, learn some new steps and practice body coordination, but I soon grew to love it. Our Latin dance teacher has a particular habit of describing dance movements in terms of coordinates and physics; rumba walks require your center of mass over your front foot for balance and look best if you extend the axis running from your shoulder to opposite leg as far as possible. This mentality has slowly creeped its way into my brain, and eventually I realized that, hey, dance really is about physics! You don’t know it while dancing, but every movement is purposeful when viewed through a pair physics-colored safety glasses.

When first starting to dance, everything is about mechanical control of your body and constantly asking the question, where is my center of mass (let's abbreviate it as COM) right now? Of course you wouldn’t consciously ask yourself that, but even without asking your body will give the answer. While posing still, if your COM is not somewhere well supported by your limbs, you’ll fall down because relative to the point of floor contact your bodyweight is generating torque on your COM. On a single limb, your COM needs to be over the supporting limb to stay balanced. On more than one limb, your COM should be somewhere between the limbs based on how your bodyweight is distributed towards each (unless the floor is slippery. Then it’s best to choose a limb to center over otherwise your supports will simply fall apart and you’ll hit the floor). When you begin to move horizontally, core muscles contract in order to support your center of mass on its journey from one place to another through fluid motion.

Spinning generates torque along other axes and accordingly makes you conscious of where your body axes are. Since torque acts along levers originating at your COM, all body axes will include your COM. Torque is defined in parallel to Newton’s second law by the equation

                                                              1.       τ=Iα    (torque equation)

Where τ is torque, I is inertia and a is angular acceleration. Inertia is related to the distribution of your body mass in space around a rotational axis. While spinning on an axis perpendicular to the ground like a ballerina or ice skater, contracting your arms from an extended position can reduce your moment of inertia and increase your angular acceleration based on the existing torque. And expanding your body to increase inertia while tilting your axis slightly can slow your spin and generate a simultaneous forward momentum to get you out of the spin and into horizontal motion. Manipulating the position of your center of mass so that it remains relatively stationary while moving around it by torque is what allows break-dancers to do such complicated flips. Dancing is all a game of mechanics.

Fig. 1: Dancing as an act of balancing forces (University of Illinois at Urbana-Champaign)

What makes Latin and ballroom dance special to me is that all of the dances are partner dances. This means double the complication, but also double the fun! Instead of your COM, your tandem COM is what counts. And all movements and spins are done together accordingly. What’s even more exhilarating is that your tandem COM is without your body, so when you go for a partner spin you’ll both be spinning about an axis between the two of you (assuming equal mass). In Latin and ballroom dance, a concept that is stressed is partner connection. This means making sure both of your bodies push against each other at the point of contact in a way that conveys information about how each of you is moving. What this also does is make the tandem COM more stable. When partner connection is weak, your tandem COM can constantly dissolve and reform. This makes both partners unstable and rely on knowing their own COMs to maintain balance. A strong connection means both partners can fully commit to the unwavering tandem COM and structure each motion together. And believe me, you can feel this. It’s really exciting when you and your partner start to move as one, and not having to worry about your own balance allows you to focus on the art of the dance.

This post is a little less reference and math heavy than some of the past ones, which I thought would be a nice break. I just wanted to share what makes Latin and ballroom dance such a special hobby to me. Dancers out there, please let me know if you think my description does dance justice in the comments below. Other Thinkers, I wanna hear your thoughts too. And check out a few minutes of this video of world-class Latin dancers. Thanks guys!


It's Just Plastic (But What IS Just Plastic)

I have a question for you. We use the stuff all the time, but do you really know what plastics are? I mean really know. I definitely didn't until this past year when I took a course on materials science that covered the nature of polymers beyond what is traditionally taught about just joining a bunch of monomers together into strings. So let’s take a closer look at a material that has revolutionized the modern age.

Plastic is a broad term for a number of synthetic polymers with varying structures, properties, origins and chemical compositions. The properties of plastics vary according to three major factors: chemical composition, tacticity and structure. Chemical composition as a factor is fairly obvious since the different types of plastic we make vary in make up. Composition affects properties of a plastic such as the range of temperatures in which it maintains its structure. Polyethylene’s (PE, No. {2,4}) melting temperature (Tm) is around 115-130°C while polypropylene’s  (PP, No. 5) Tm is around 130-170°C. The only difference between these two polymers is an extra methyl group every other backbone carbon in the case of PP. Chemical composition also informs how a polymer is produced. Polyethylene terephthalate (PETE, No. 1), the plastic most water bottles are made of, is synthesized through the transesterification of terephthalic acid and ethylene glycol while many other polymers such as PE, PP and polystyrene (PS, No. 6) are produced by free radical polymerization. Copolymers, or polymers made with more than one monomer type, also exist in a variety of forms (block, graft, random and alternating) with more limited usage.

Fig. 1: Free radical polymerization of PS (California State University, Dominguez Hills)


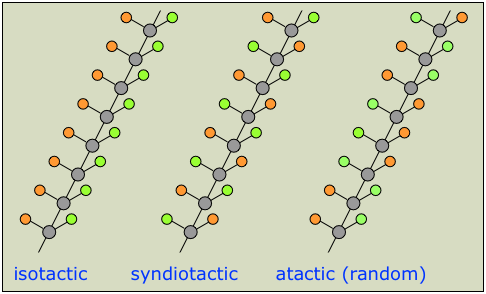
Polymer tacticity is another property of plastics, but one you usually don't hear about. Tacticity relates to the organization of monomer units within polymer strands. There are three categories of polymer tacticity: isotactic, syndiotactic and atactic polymers in order of increasing variability. Isotactic polymers are comprised of monomer units all connected in the same way to each other. Syndiotactic polymers have every other monomer unit in the same orientation and atactic polymers are oriented any which way.

Fig. 2: Isotactic, syndiotactic and atactic polymer models (University of California, Davis)

Different synthesis methods affect the tacticity of the produced polymer,  for example the use of metal-catalyzed polymerization reactions may enact more stereospecific polymer synthesis [1]. Tacticity mainly affects whether or not a polymer can form crystalline regions. Isotactic PS, for example, is more likely to form crystalline regions through pi-stacking than atactic PS is. Plastic performance is also sometimes affected directly by tacticity, as with isoprene rubber. Natural isoprene rubber is isotactic in that it is comprised entirely of cis-double bonds, which make it springy. Atactic isoprene rubber or isotactic trans-polyisoprene rubber are relatively unspringy [2].

A plastic's three-dimensional polymer structure has a lot to do with the macroscopic properties of a plastic. Polymers exist as spaghetti-looking chains of controllable length that bundle and stack into a giant mess. Each chain can be linear, branched, dendritic or cross-linked to other chains. When pulled upon intensely, linear polymer chains slide out from underneath each other and cause plastic deformation. Branched or dendritic polymer chains can make this harder to do, and cross-linked polymer chains, like vulcanized isoprene rubber, can be extremely hard to plastically deform (not a pun, I swear. It’s a type of deformation, along with elastic, related to a material’s tensile strength).

Fig. 3: Some possible polymer morphologies (Nature)

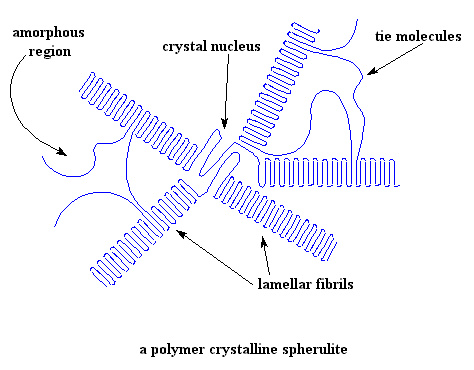
But if this is true, why does high-density polyethylene (HDPE, No. 2), made of linear polymer chains, have a lower tensile strength than its cousin branched low-density polyethylene (LDPE, No. 4)? This is due to crystal packing. When polymer strands organize, they form microcrystalline regions surrounded by amorphous, glassy regions.

Fig. 4: Crystalline and amorphous polymer structure (Polymer Science Learning Center)
Being linear allows HDPE to organize into a higher crystalline content than LDPE, and the extra intermolecular forces associated with these crystalline regions makes HDPE harder to deform than its other form. Fun fact, polymer crystallinity also has an effect on opacity in the same way the amorphous nature of glass causes its transparency, crystalline regions generally being more opaque than amorphous regions.

Due to their low capacity for biodegradation, the ubiquitous use of plastics in our society poses a serious problem for many environmentally-concerned individuals, and for good reason. Current plastic recycling programs are, to be frank, lacking, and this is majorly brought on by the economic limitations of recycling. Cultural attitudes towards sorting trash and recycled products also affect the efficacy of recycling programs. However, grass-roots activism and local- and national-level legislature are quickly changing opinions on the matter of plastic recycling. Knowing which plastics are recyclable (PETE, No.1, and HDPE, No. 2, only in many areas) will help to reduce the cost of sorting recyclables with a little effort, and public pressure for wider recycling programs may light a fire under companies to increase recycling, assuming the science exists. Research related to the synthesis of biodegradable polymers has picked up in recent years to produce products like polylactic acid (PLA, No. 7 (other)), but subsidies or funding is always welcome with science. If you're interested, these are things to talk to your local government representative about. 

So there you have it, a brief overview of the chemical and structural background of plastics (and a little bit on the side). Plastics are quite complicated and therefore impossible to talk about in depth through any medium shorter than a book, but if you want to hear more about specific aspects of polymers let me know in the comments and I’ll be happy to do so. Thanks!

Thoughts in Black Ink

The only foreign language that I claim to know is Japanese. I started studying Japanese in elementary school and took courses throughout middle and high school as well. Simple Japanese books, everyday conversations and Japanese YouTubers are fine for the most part, but vocabulary is still a problem for me. While at work the other day, I decided to practice some new terms I read on a blog post.

Fig. 1: Vocabulary practice (orig.)

Papers covered in words like this are scattered all over my room. Sometimes the need to write just gets to you, you know? Staring at the scribbled words, I suddenly thought, what is this stuff I’m writing with anyways? 

Ignoring the fancy colors, black pen ink is a relatively simple composition made of carbon black suspended in drying oils, alcohols or petroleum products [1]. Carbon black is carbon powder obtained by burning organic matter. This type of black ink has been around for thousands of years, and I use another form of the same stuff while doing Japanese calligraphy. East Asian calligraphy ink is traditionally made of pine soot (carbon black) mixed with bindings and herbs. This page provides a more in-depth description of how sumi, or a Japanese ink stick, is made.

Fig. 2: Carbon black sample molecular structure (Bruno Glaser)

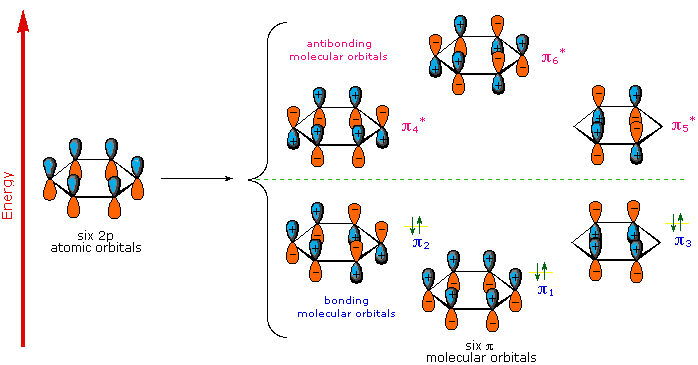
So why is carbon black... black? Writer Maggie Koerth-Baker does a good job of describing this. In organic chemistry, pi-conjugated systems, or systems where electrons of sp2 hybridized atoms are delocalized in combined p-orbitals, can exhibit a wide range of light absorption and emission properties. This is because of the many possible bonding and antibonding p-orbital orientations within the conjugated system.

Fig. 3: Molecular orbital states for benzene (Michigan State University)

When we talked about why excited metals emit colored light back in The Dazzling Chemistry of Fireworks, we mentioned that the Fermi level of metals is located within an electronic band, meaning that electron transitions between the highest occupied energy level and other higher energy electron states are possible over a range of values. The many available higher energy electron states are not unlike the many possible organizations of bonding and antibonding orbitals in pi-conjugated systems. An incident photon on a pi-conjugated system can upset the shared p-orbital system into occupying one of the possible antibonding arrangements, later to reemit the light energy at lower, sometimes non-visible spectrum, wavelengths. Pi-conjugated systems that include more atoms result in more complex molecular orbital states. And when conjugated units of varied length exist together in a material, then on the whole even more electronic states are possible! All of these electron transitions cooperate to make the familiar black ink of pens (graphite pencils too, just think about it).

If you enjoyed this post and those I've written before, share your thoughts in the comments to let me know!

On The Definition of Sustainable Energy

Let’s finally cover what I meant by truly sustainable energy production.

Listing electrical energy generation methods portrayed as sustainable, many would consider solutions such as solar power, wind turbines, hydroelectric dams, geothermal plants, sun farms, wave generators, nuclear power and nuclear fusion to fit the image of futuristic green power. But while all of the above may be green, not all of them are sustainable. To me at least, it seems that green energy is measured from the present as a bench point: anything that produces less greenhouse emissions or causes less ecological destruction than methods currently employed is considered "green." However, sustainable energy production is a more definite construct that can be described through thermodynamics.

From thermodynamics we know that every work-energy conversion in our universe is irreversible, meaning that energy is lost as heat every time something is done. Taking the planet earth as a giant engine, which is accurate in the sense that most life processes convert available energy into work and expend heat, we can conclude that the earth needs constant energy input in order to continue running. Aside from ambient space radiation produced by other sources, the sun is the only source of energy earth knows consistently from day to day. This is something many of us should experientially understand, contrasting the death of winter when days are short to the blossoming of spring when long sunlight returns.

Fig. 1: Boston sun angle during the seasons, affecting solar energy influx (Science Blogs)

Therefore, in order to be sustainable within the lifetime of our sun, an extremely high life expectancy for planet earth, our energy generation tactics should be geared towards the sun’s life-giving energy. Does this mean that solar is the only way to go? No, absolutely not. The sun’s energy hitting the earth enacts a grand cascade of events that grow wind, help generate tides and keep the water cycle flowing. This extends the definition of sustainable energy generation to include wind power, wave power, and hydroelectric generation.

Another side category of what I would consider sustainable energy sources includes those whose failure would correspond with the end of life on earth. One example is geothermal energy. Sure, eventually the earth’s core may cool down, but there would be bigger problems associated with this scenario than humans running out of electricity, such as the dissipation of the earth’s magnetic field letting a bombardment of solar radiation char the planet. Wind power may also be considered part of this category, as wind is in part generated by the Coriolis Effect that depends on the earth continuing to spin. If the earth stopped spinning, bad things would ensue.

So what is not covered under the definition of sustainable electricity generation that is commonly perceived as such? The top two that really get to me are nuclear energy and fusion energy. The selling point of nuclear energy is that it is clean in terms of greenhouse gas generation. However, clean does not directly translate into sustainable. The input into nuclear reactors is uranium, and lots of it. Uranium is not an uncommon element on earth, but a large 1000MWe nuclear power plant requires about 200 tons of refined uranium to operate for one year [1]. Refining uranium is itself a wasteful process, and mining large amounts of ore has an ecological impact as well. Nuclear fusion is often sold as the sustainable energy solution of the future, but in actuality nuclear fusion requires the same input as the sun does: hydrogen. With so much hydrogen on earth, why would this be a problem? Call me paranoid, but any time someone wants to convert something necessary for life into a luxury item (yes, electricity is a luxury item) and some useless helium, then I begin to worry. And relative to the sun’s supply of hydrogen, earth’s hydrogen bank is chump change. The hydrogen fusion reaction that generates the most energy is that of deuterium (1H2) with tritium (1H3) as described by this equation [2]:

                                                        1.  1H2 + 1H3 = 2He4 + neutron

If we calculate the mass difference

       2.  m(2He4) + m(neutron) – m(1H2) – m(1H3) = 4.002602 + 1.008665 – 2.01412 – 3.016050  =                   5.011267 – 5.030152= -0.018885 amu

then insert this mass difference into Einstein’s mass-energy equation

                  3.  ΔE=Δmc2
                  4.  Δm=0.018885 amu(1.66053892 x 10⁻²⁷ kg/amu)
                  5.  E=(3.135928 x 10⁻²⁹ kg)(3 x 10⁸ m/s)2 = 2.82 x 10⁻¹² J/He nucleus formed

and convert the result into a meaningful number

       6.  2.82 x 10⁻¹² J/He(2.778 x 10-7 kWh/J)(1 He nucleus formed/2H nuclei consumed)=
            3.92 x 10⁻¹⁹ kWh/H nucleus consumed(6.022 x 10²³ H nuclei/mol H)(1 mol H/((2.014102 +                   3.0160492)/2) g) = 9.39 x 10⁴ kWh/g H

we get that 9.39 x 10⁴ kWh of power can be generated from one gram of hydrogen gas (assumption made that hydrogen composition is half deuterium, half tritium). Considering that the average American consumes 10,908 kWh annually [3] and that the population of America is about 321 million [4], approximately 37,300 kg of hydrogen gas would be consumed annually to support America alone by fusion energy. This is not zero input.

All in all, what I am trying to say is that science has laid out a very specific definition of what sustainable energy truly is, so it is the job of every person to evaluate whether what is being portrayed as sustainable energy generation is truly backed by the facts.

Does your definition of sustainable energy sourcing differ? Let me know your thoughts in the comments below!

A Quick Coffee Break

I know that I promised an explanation of what I meant in the last post by truly sustainable energy, and I still owe you guys that. But I wanted to take a quick break from environmental talk to discuss something of great importance to me: coffee. Everyday on the way to work, I stop by Dunkin’ Donuts to pick up a small iced coffee dark roast with cream and sugar. I’m there frequently enough that the employees have begun to reckon a pattern in my order (which basically doesn’t change). Some people aren’t coffee drinkers at all, and neither was I until I started college. The class that broke me was MSE 220. Don’t get me wrong, it was one of the best classes I’ve ever taken. It’s just that a dark, warm classroom was not conducive to my concentration as much as my nodding off.

Fig. 1: The usual Dunkin' Donuts morning coffee (orig.)

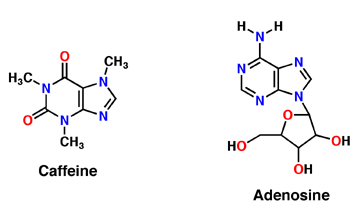
So let’s back up this post with a bit of content: coffee’s main active ingredient, as I’m sure you know, is caffeine. This relatively small organic molecule is the most widely consumed psychoactive drug and makes an appearance in many foodstuffs, especially in beverages. As a drug with dopamine-producing properties, it can be a source of addiction, though the symptoms of withdrawal are much lighter than those of controlled substances. The caffeine content for coffee, tea and soda types can be found here if you’re interested.

Fig. 2: Caffeine and adenosine molecules (University of Texas at Austin)
Caffeine works by competitively binding with adenosine receptors on neurons and is therefore deemed a receptor antagonist of all adenosine receptor types (A1, A2A, A2B and A3) [1]. Adenosine is a central nervous system neuromodulator that binds to receptors on neurons, slowing neuronal activity, dilating blood vessels and causing sleepiness [2]. I’m not good at tracking signaling pathways, but information on the adenosine pathway can be found here. When caffeine binds to the adenosine receptor, adenosine can no longer bind to slow neuronal activity and sleepiness is defeated. The increased neuronal activity caused by caffeine also induces the pituitary gland to secrete adrenaline and institute a state of “fight or flight” activity, another way caffeine energizes the sleepy world round [3].

Besides caffeine, there is other chemistry going on in coffee as well. A morning coffee is a good source of antioxidants (good for reasons mentioned in A Bit on That Shampoo Vitamin) and has been identified as the number one source of antioxidants in America, followed by black tea [1]. Coffee also has a nice hearty flavor, especially with my dark roast coffee, that comes from caramelization and Maillard processes (discussed back in Party Science, Part 3: The Tasty Grub) as well as the subtle bitterness of caffeine. And there you have it, a small cup of coffee science.

I’m going to try posting more photos that I take myself, but I’m not particularly trained in photography and only have my phone camera for the moment. Regardless, let me know what you think of the photos and if you have any photography tips I’d love to hear them. Anything helps!